In May 2024, Bradenton Beach, FL homes were selling for an average price of $1,160,980, Bradenton Beach, FL homes on average sell after 85 days on the market compared to 91 days last year. There were 5 homes sold in Bradenton Beach, FL for May 2024, compared to 1 last year.
The average list price of Bradenton Beach, FL, was $1,756,091 in May 2024, compared to $2,248,037 in May 2023.
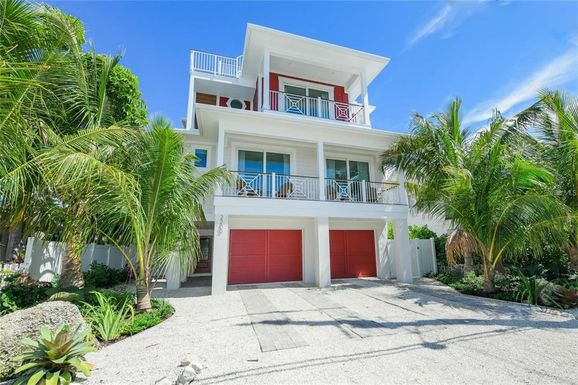
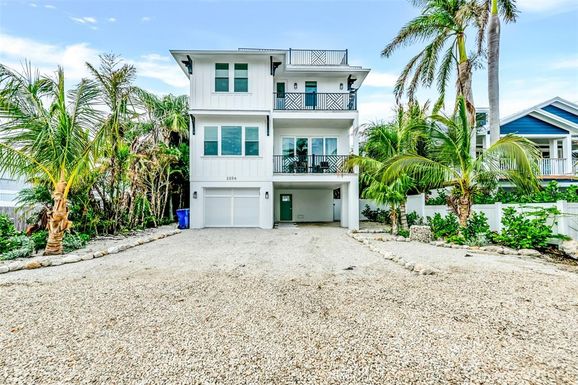
Bradenton Beach, FL Market Trend for Houses
Average List Price
The average list price of houses in Bradenton Beach, FL, was $3,590,646 in May 2024, compared to $3,117,056 in May 2023.
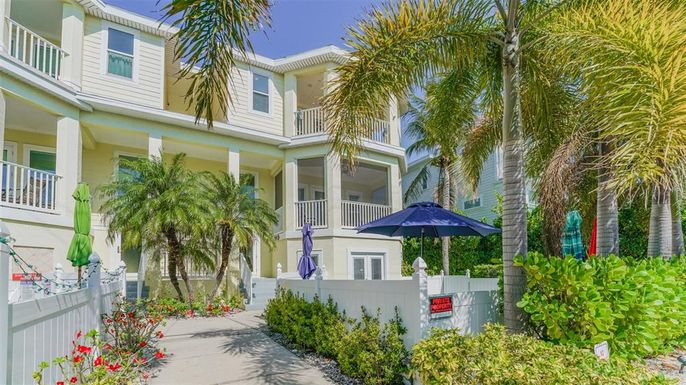
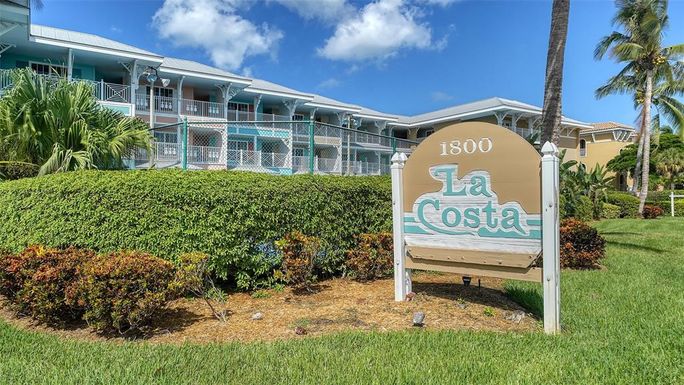
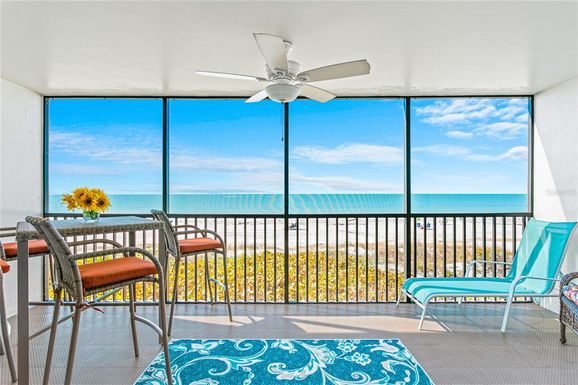
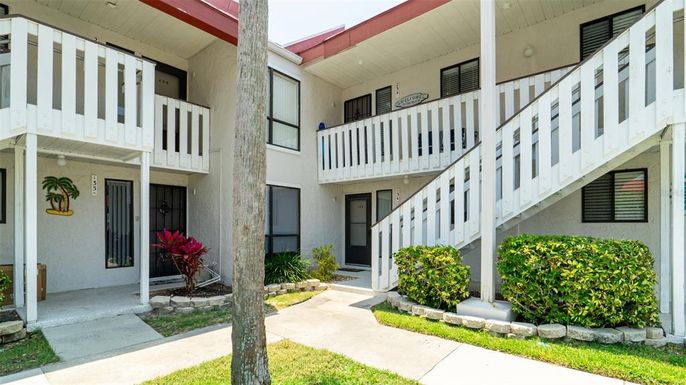
Bradenton Beach, FL Market Trend for Condos / Townhouses / Penthouses
Average List Price
The average list price of condos/co-ops in Bradenton Beach, FL, was $576,872 in May 2024, compared to $510,000 in May 2023.
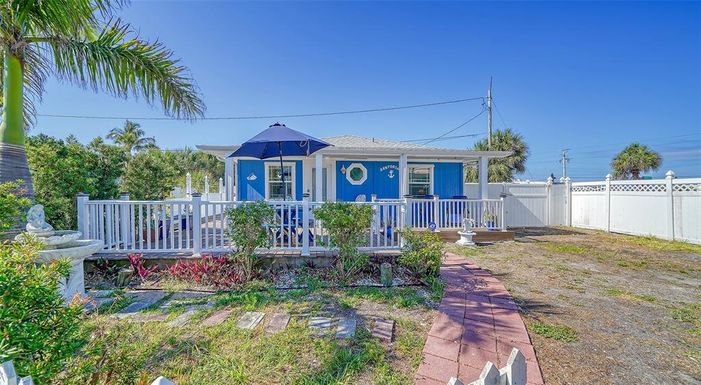
Bradenton Beach, FL Market Trend for Lots/Land
Average List Price
The average list price of lots/land in Bradenton Beach, FL, was $1,239,111 in May 2024, compared to $0 in May 2023.
Bradenton Beach, FL Market Trend for Commercial
Average List Price
The average list price of commercial in Bradenton Beach, FL, was $0 in May 2024, compared to $0 in May 2023.
Bradenton Beach, FL Housing Market Analysis
The average list price in Bradenton Beach, FL is $1,756,091. The average list price in Bradenton Beach, FL went down 21.88% from 2023 to 2024. Bradenton Beach, FL home resale inventories is 32, which increased 966.67% since 2023. The average list price per square foot in Bradenton Beach, FL is $935. 2023 it was $933.